W.D. Gann’s 12 Rules Trading in Stocks
Rule 1. Determining the Trend
“For traders, trend is your friend. Besides drawing trendlines for the individual chart you are trading, it is important to determine the trend of the market index and the industry index that you intend to trade. This is to confirm if the trend of the individual stock is in line with the industry trend as well as the overall market trend.”
The following charts 1a, 1b and 1c shows that the market (KLCI index), the sector index (Finance index) and the individual (Maybank) all exhibited bearish trend during the given period.
Fig 1a
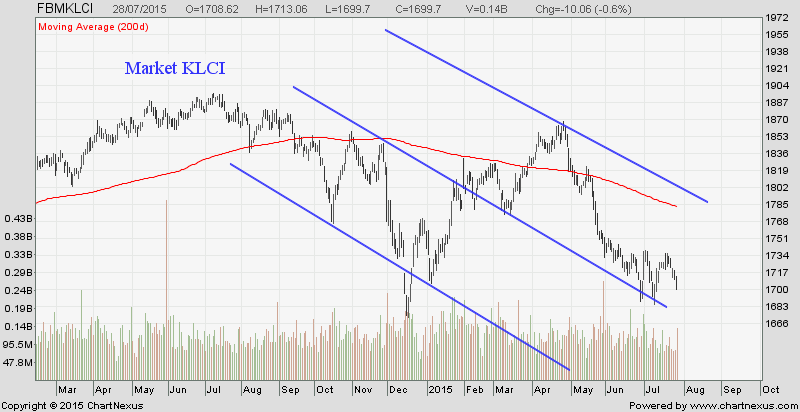
Fig 1b

Fig 1c

Rule 2. Buy at Single, Double and Triple Bottoms
“Buy at single, double or triple bottoms. The fact that prices rebound from the previous low is an indication that this bottom is a support zone. After you have made a trade, do not forget to place a stop to protect your position. Do not overlook the fact that the 4th time the stock reaches the same level, it is not as safe to buy, because it nearly always goes through. Reverse this rule at the top.”
Rule 3. Buy and Sell on Percentages
“Buy or sell on a 50% decline from any high level or a 50% advance from any low level so long as these reactions or rallies are with the main trend. You can use the percentage of the individual stocks as well as the percentage of the market index to determine the resistance levels. The resistance levels are: 3-5%, 10-12%, 20-25%, 33-37%, 45-50%, 62-67%, 72-78%, 85-87%. The most important resistance levels are 50% and 100%.”
See the following examples:
Figure 2 shows that the KLCI achieved a top at 1860, the first low is 3.33% reaction point from the top. Subsequently, the next low is 9.1% from the peak, which is close to the 10% reaction point.
Fig 2

Figure 3 shows the monthly chart for the S&P 500 achieved a peak prior to the 2008 financial crisis. During the peak of the mortgage subprime crisis, the S&P 500 fell 53% which is close to the 50% important resistance level that Gann discovered. These are important discoveries by Gann as this insight gives us a direction of when is the peak or bottom.
Fig 3

Rule 4. Buy and Sell on 3 Weeks’ Advance or Decline
“Buy on a 3 weeks’ reaction or decline in a bull market when the main trend is up, as this is the average reaction in a strong bull market. In a healthy bull market, it is perfectly normal for the price to undergo correction. If the correction lasts for 3 weeks, that’s a buying opportunity if you want to “buy in dip” in a bull market.
After the market advances or decline 30 days or more, the next time period to watch for tops and bottoms is around 6 to 7 weeks, which will be a buying or selling level, protected, of course, with a stop loss order according to resistance levels.
After a market rallies or declines more than 45 to 49 days, the next time period is around 60 to 65 days (12 to 13 weeks) which is about the greatest average time that a bear market or bull market reacts.”
Figure 4 depicts the weekly chart for KLCI. We can see that during the bull run, the index follows a healthy correction of not more than 6 weeks each time within the given period. However, in 2014 July onwards, the KLCI experienced 23 weeks of downtrend, this is greater than “the 12 to 13 weeks, the greatest average time a bull market reacts,” as stated by Gann.
Fig 4

Rule 5. Markets Move in Sections
“Stock market campaigns move in 3 to 4 sections or waves. Never consider that the market has reached the final top when it makes the first section in a move up, because if it is a real bull market, it will run at least 3 sections an probably 4 before a final high is reached.”
Figure 5 shows the STI chart. It is quite clear that we see that the STI follows this 3-4 waves theory quite well.
Fig 5

Rule 6. Buy or Sell on 5 to 7 Point Moves
“Buy or sell individual stocks on reactions of 5 to 7 points. When a market is strong, reactions will run 5 to 7 points, but will not decline as much as 9 or 10 points. By studying the Industrial Averages you will see how often a rally or reaction runs less than 10 points. However, it is important to watch 10 to 12 points rallies or declines for buying or selling levels on the average.
The next important point to watch is 18 to 21 points up or down from any important top or bottom. Reactions of this kind in the Averages often indicate the end of a move.
When to take profits? Follow the rules and do not take profits until there is a definite indication of a change in trend.”
Figure 6 depicts the price chart of Maybank. We shall use 10 cents to represent 1 point in this example. Maybank achieved RM10.20 as the peak and underwent a bear rally that reached a bottom of RM8.30, which represents RM1.90 or 19 points decline and it’s the end of a move. Subsequently, Maybank rebounded to RM9.25, RM0.95 or 9.5 points, which was below the 10 point move as stated by Gann.
Figure 6

Rule 7. Volume of Sales
“Study the total volume of sales on the New York Stock Exchange in connection with the time periods. Study the volume of sales on individual stocks, as the volume of sales will help in determining when the trend is changing.”
Volume of sales basically gives you a direction whether the current trend is strengthening or weakening. In a typical extreme high year, the volume of sales is high for that particular year as retail investors are attracted into the stock market. Similarly, in an extreme low year, the volume of sales is also high, this is because retail investors are selling down the market in panic.
In a bullish trend, we shall see price rises together with volume rises. If price continues to rise but volume declines, it is an indication that the market has lost momentum and very soon price correction is around the corner.
In a bearish trend, if we see rapid decline in price together with a surge in volume, it is an indication that the selling pressure is gathering momentum, and the bearish trend is expected to persist. However, as prices continue to decline with a lighter volume, we may expect a change of trend in imminent.
Gann also states that the volume of sales has to be studied together not only with the price change but also with the time periods. We shall see in the next section.
Rule 8. Time Periods
“The time factor and time periods are most important in determining a change in trend because ‘time’ can over balance ‘price’ and when time is up, the volume of sales will increase and force prices higher or lower.
Market over-balanced – The averages or individual stocks become over-balanced after they have advanced or declined a considerable period of time, and the greater the time period, the greater the correction or reaction. When the time period on a decline exceeds the time period of a previous decline it indicates a change in trend. When the price breaks a greater number of points than the previous decline or reaction, it indicates that the market is over-balanced and a change in trend is taking place.
Reverse this rule in a bear market. When stocks have been declining for a long period of time, the first time that a rally exceeds the time period of a previous rally it is an indication that the trend is changing, at least temporarily. The first time that the price rallies a greater number of points than a previous rally, it indicates that the ‘space’ or price movement is over-balanced and a change in trend has started. The time change is more important than reversal in price. Apply all of the rules to see if a change in trend is due at the time when these reversals take place.
When the market is nearing the end of a long swing or a long downswing and reaches the 3rd or the 4th section, the swings upward will be smaller in price gains and the time period will be less than the precious section. This is an indication that a change in trend is due. In a bear or declining market, when the loss in points becomes less than the previous section and the time is less, it is an indication that the time cycle is running out.”
In layman term, it is important to record down the duration of trends in the market or the individual stocks. For example, during the 2011 US debt ceiling crisis, the US, Malaysia and the Singapore equity markets all experience a bearish trend that lasted for 8 weeks.
In addition, it is important to record down the reaction time period. For example, in a bear trend, record down the duration for each bear rallies, if the current rally is longer than the previous, it indicates inherent bullishness in the trend, especially, when the bear rally is the 3rd or the 4th in a prolong bear trend.
Rule 9. Buy on Higher Tops and Bottoms
“Buy when the market is making higher tops and higher bottoms which shows that the main trend is up. Sell when the market is making lower tops and lower bottoms which indicates the main trend is down. Time periods are always important. Check the time period from previous top to top and from previous bottom to bottom. Also check the time required for the market to move up from extreme low to extreme high and the time required for prices to move down from extreme high to extreme low.”
Rule 10. Change in Trend in Bull Market
“A change in trend often occurs just before or just after holidays.
Bull market ending: When prices on the Industrial Averages or individual stocks break the last low on a 9-point swing chart or break the lst low on the swing on a 3-day chart, it is an indication that the trend is changing, at least temporarily.
Bear market: In a declining market when prices cross the top of the last upswing on a 9-point chart, or cross the top of the last upswing on a 3-day chart, it is the first signal for a change in trend. When prices are at high levels there are usually several swings up and down; then when the market breaks the low of the last swing it indicates a reversal and a change in trend.
At low level prices often narrow down and remain in a narrow trading range for some time, then when they cross the top of the last upswing it is important for a change in trend.
Always check to see if the market is exactly 1,2,3,4 or 5 years from any extreme high or low price. Check back to see if the time period is 15,22,34,42,48 or 49 months from any extreme high or low price, as these are important time periods to watch for a change in trend.”
For the context of KLCI, I notice its a 40 points and 80 points reactions. For example, when the KLCI is advancing and reaching a visible top, then a reaction or price drop more than 40 points per day or 80 point per week, then it is an indication that there is a change of trend from bullish trend to bearish trend. The reverse is true for a bottom.
Rule 11. Safest Buying and Selling Points
“It is always safest to buy stocks after a definite change in trend has established. After a stock makes bottom and has a rally, then follows the secondary reaction and it gets support at a higher bottom. When it starts to advance and crosses the top of the first rally, it is the safest place to buy because the market has already given an indication of uptrend. Stop loss orders can be placed under the secondary bottom.
Safest selling point: After a market has advanced for a long time and made final high and has the first sharp quick decline, then rallies and makes the second lower top, and from this top declines and breaks the low point of the first decline, it is then safer to sell because it has given the signal that the main trend has changed to the down side.
Remember that stocks are never too high to buy as long as the trend is up; and they are never too low to sell as long as the trend is down. But do not overlook the fact that you must always use a stop loss order for your protection. Always go with the trend and against it. Buy stocks in strong position and sell stocks in weak position.”
Rule 12. Price Gains in Fast Moves
“When markets are very active and advancing or declining very fast they average about 1 point per calendar day. When the movement on averages or individual stocks is 2 points or more per day, it is far above normal and does not last very long. Movements of this kind occur when there are short time periods and a quick corrective reaction or decline in a bull market. When the trend is down in a bear market these quick fast rallies correct the position in a short period of time.”
It says that big price change usually doesn't last very long. For example, KLCI, you may have 40 points increase for one day, but you hardly see 40 points per day for consecutive days, its just not sustainable.
Note: To give you a perspective, the DJIA was trading at 80 - 380 points between 1920 to 1929.
Background
William Delbert Gann, usually referred to as W.D. Gann, attained legendary status as a market operator on Wall Street between 1900 and 1956.
He was born in East Lufkin Texas on June 6, 1878 , which at the time was cotton-growing country. He spent his teenage years working as a cotton warehouse clerk.
In 1902, Gann began trading the stock and commodity markets. In 1908, he moved to New York City and it wasn’t long before he opened his own brokerage firm, W.D. Gann & Co, on 18th and Broadway.
His storied success began early. In the month of October 1909, while being observed by a representative of Ticker Tape Magazine (the Barron’s of the day), Mr. Gann executed 286 trades in various stocks on both the long and short side of the market. He profited on all but 22 of these trades. By the end of this 25-day period, his starting capital had increased by 1000%.